Polaris SQL/Reports Forum
March 27, 2024
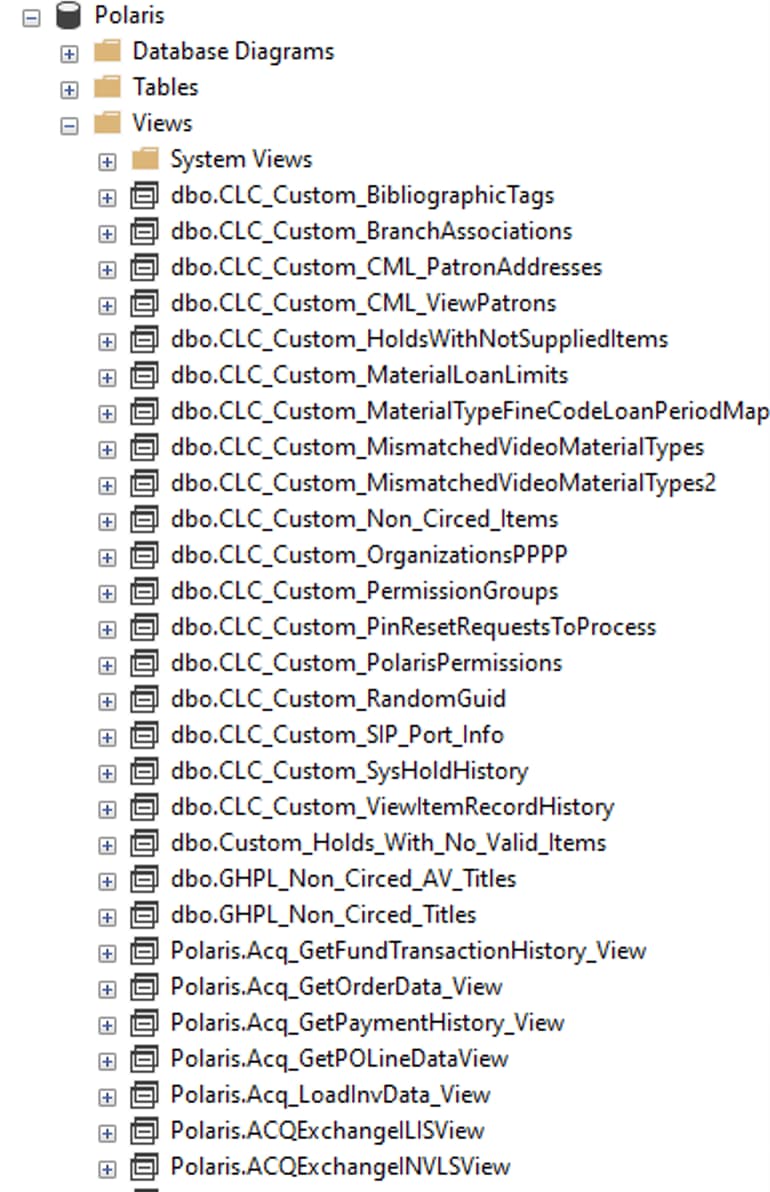
SQL Resources
- Polaris Database Repository – (must be logged into Innovative Supportal first)
- IUG Forums
- IUG Discord
- Polaris Clearinghouse repository
Why should I learn SQL? How does this differ from SimplyReports?
- SimplyReports is useful for creating custom reports with a (somewhat) intuitive interface, but it does have limitations. Specifically, it can only output specific columns and can only use the pre-determined filters available in the content drawers.
- SQL gives complete access to the Polaris database. Every piece of information in Polaris is stored somewhere in a table in the database. With SQL, users can query those tables and retrieve exactly what they are looking for.
- SQL is also completely text-based, so queries can be copied and stored for later. Rather than re-creating an entire search in SimplyReports, it’s sometimes easier to simply copy and paste a previously built query.
- SimplyReports is based on SQL. In the background, SimplyReports builds a SQL query based on the user input and sends that query to the Polaris database.
How do I see the query that SimplyReports builds?
- Create and run a report in SimplyReports as normal. After clicking Submit, you’ll be taken to the report results page.
- On the report results page, right click and select “View Page Source” or in most browsers, press CTRL+U.
- If prompted with a “Confirm Form Resubmission” message, hit Refresh in the browser or press F5. The browser will display the HTML that generates the page.
- Press CTRL+F to search the HTML page. Search for SQLStatementHide
- Following the SQLStatementHide text, the “value” field will display the SQL query. (It starts with “Select”). Select the text and copy it.
- Paste the text into NotePad or a preferred text editor. The query will be formatted for the web, so it may be necessary to add line breaks for readability or convert certain text like date fields.
Why can’t SimplyReports search for specific MARC data? Coming from a Sierra system with access to Create Lists, this feels like a very serious limitation.
- That is correct that SimplyReports cannot search for specific MARC fields/subfields.
- The only way to search for specific MARC tags is through SQL. This can be a barrier for many staff, so it’s recommended to save some pre-built queries to the Bib Find Tool:
Bibs with Specific Tag
SELECT DISTINCT BR.BibliographicRecordID
FROM BibliographicRecords BR
JOIN BibliographicTags BT ON BR.BibliographicRecordID = BT.BibliographicRecordID
WHERE BR.RecordStatusID = 1
AND BT.TagNumber = 263
Bibs with Specific Tag and Subfield Data
SELECT DISTINCT BR.BibliographicRecordID
FROM BibliographicRecords BR
JOIN BibliographicTags BT ON BR.BibliographicRecordID = BT.BibliographicRecordID
JOIN BibliographicSubfields BS ON BT.BibliographicTagID = BS.BibliographicTagID
WHERE BT.TagNumber = 250
AND BS.Subfield = 'b'
AND BS.Data LIKE '%'
- For both queries, the tag number can be replaced with the 3-digit tag number.
- For subfields, the subfield should be placed between single quotes.
- For subfield data, the percent sign is a wildcard (when used with LIKE). The wildcard should almost always be used at the end of the phrase (to account for punctuation), but it can also be used at the beginning too.
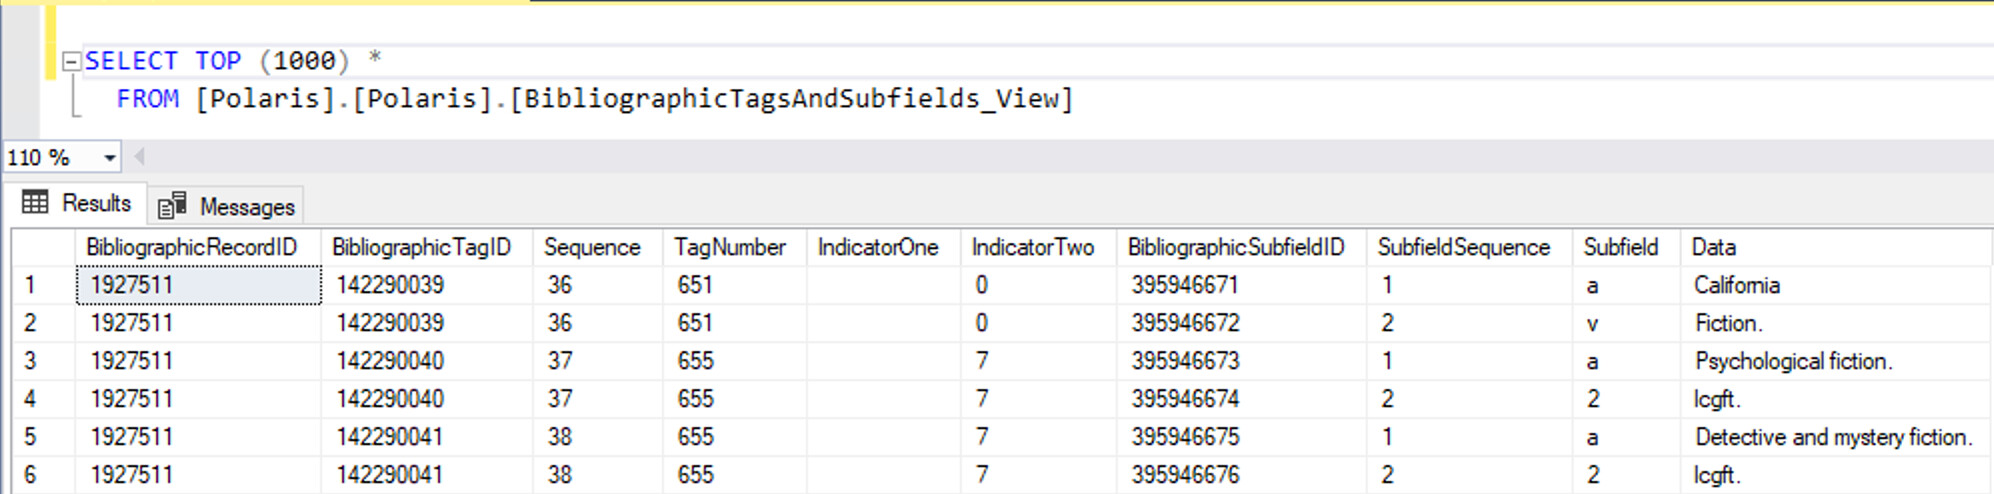
The MARC data tables seem unnecessarily complicated. Why do we need to join 3 tables together just to look at a single field? Wouldn’t it make more sense to have all of this data in one table?
- We’re speculating, but this likely has to do with database theory and how tables should be structured. The Polaris data tables were designed to accommodate MARC as it existed when it was built, and into the future. As new tags/subfields have been added to the MARC model, the Polaris tables are able to easily include them.
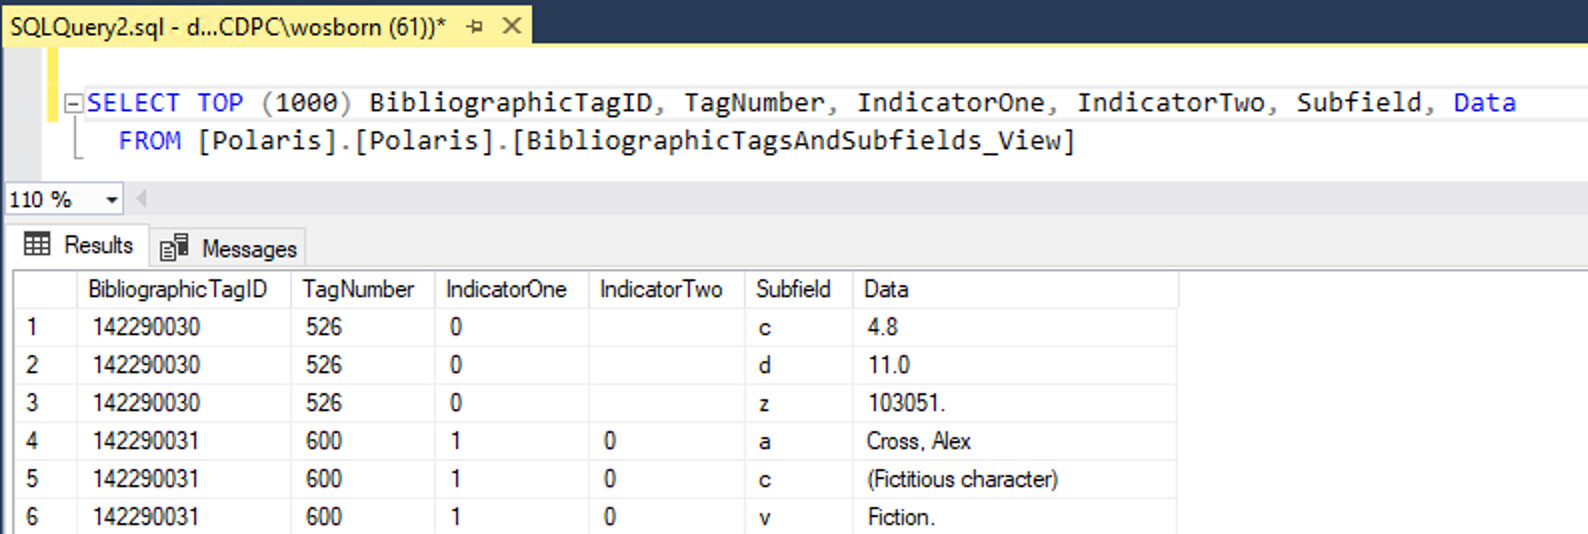
- Theoretically, a more human-friendly structure would likely include tags and subfields in a single table that contained columns for the tag number, Indicators 1 & 2, the subfield code, and the actual data. For example:
| TagID | TagNumber | Indicator1 | Indicator2 | Subfield | Data |
|---|---|---|---|---|---|
| 1234 | 245 | 1 | 0 | a | SQL in a nutshell : |
| 1234 | 245 | 1 | 0 | b | a desktop quick reference / |
| 1234 | 245 | 1 | 0 | c | Kevin Kline, Regine O. Obe, and Leo S. Hsu. |
- In this theoretical example, the TagID, number, and indicators are repeated which adds to database size and creates the potential for data mismatches. In database-speak, this violates 2nd Normal Form.
- The general assumption is that these Polaris tables were designed to follow normalization rules. As a result, we end up with a structure that makes sense for the database, but is more difficult for human readability.