What kind of statistics and KPI are you providing to or for your libraries? Is there any reasoning behind it or is it just the way things always have been done?
There are many other SSRS reports (plus SimplyReports and visualizations via Elastic/Kibana) that the libraries have access to and may make regular use of, but we have set of statistical reports that we send monthly and annually to the libraries. These were largely determined through committee discussions after we migrated to Polaris (with some changes since then). The committee determined the types of high-level stats they wanted collected, plus parameter details such as governing branch for circ (transaction branch), etc. The reports show consortial totals with a breakdown by library. Branch-level stats are provided in a second chart in the same report in some cases, and in a separate report in others.
Monthly/Annual Reports include:
Library Circulation by Transacting Location
Circulation of Materials by Age Group
Interagency Circulation Summary (Item Library to Patron Library)
Interagency Holds (Item Library to Pickup Library)
Patron Summary
New Patron Summary
Annual-only Reports:
City and RM Summary (for the regional libraries; how much are their branches used by patrons from their various municipalities)
CULC Item and Title holdings (so the city libraries can provide stats to the Canadian Urban Libraries Council)
SILS Bib and Items counts (broken down differently that CULC reports)
It’s been a few years since we really revisited the discussion of which stats to track at a high level, but part of the intention behind setting these up was to ensure ongoing comparability through consistency. It’s a lot, and how much the stats in each report are used likely varies among the libraries.
This would be a good topic to discuss at the consortium zoom forum!
2 Likes
For a lot of stats we try to train libraries up on how to use the tools we provide themselves, though those tools do include a bunch of custom dashboards and canned reports.
For things we proactively send out on a regular basis:
- transaction counts by workstation
- checkout cross tab report of owning location by transaction location
- transaction counts from online services we provide (shared overdrive collection, usage of our mobile app)
- various reports that are directly tied to the annual statewide reports
The dashboards we maintain pull data daily or monthly depending on the exact chart and serve a variety of needs and track all sorts of things, mostly aiming to plug gaps that are either difficult to accomplish or entirely lacking in other tools. Checkouts by hour, daily patron counts, daily counts of items in transit to/from a location, monthly checkout totals extending past the data retention period of other tools, daily card registrations through our online form, etc…
1 Like
Similar to the other responses, many of our members pull reports indepedently or have custom reports, but we do have a few that we send out monthly. We are a Polaris consortium and send out:
- Item Circulation by Collection
- Circulation by Items Loaning Branch
- Item Circulation Statistics (Circ by Mat type)
- Patron Circulation Statistics (Circ by Borrower Type)
- Statistical Summary
We also have a custom report that counts all items sent Request in Transit to non-owning libraries. It’s basically a fancy reworking of Circ by Loaning Branch that gives us a snapshot of who is borrowing from whom/sending to whom.
Most of these have been staples of our monthly reporting since we moved to Polaris about 10 years ago. In recent years, I’ve held meetings with stakeholders to try and understand which of these are actually used, and for what purposes, but no changes were made. Every report had at least one library who claimed it was a critical report for them, so shrug.
Thanks everyone! My consortium is re-examining the KPIs we provide to libraries to explain why being part of the system is such a good idea for them. It’s good to know that libraries are similar in their demands across geographies and ILSes!
Our statistics are driven by the State Library’s (FL) reporting required for annual State Aid applications. Via Polaris, I collect circ by branch and # of borrowers by branch. Branches maintain programming numbers (by age and format), door counts, laptop usage and volunteer hours via a shared Excel worksheet. Each year around this time, I review new state reporting requirements and adjust our stat form to match. I’m always pleased to reduce our stat collection metrics.
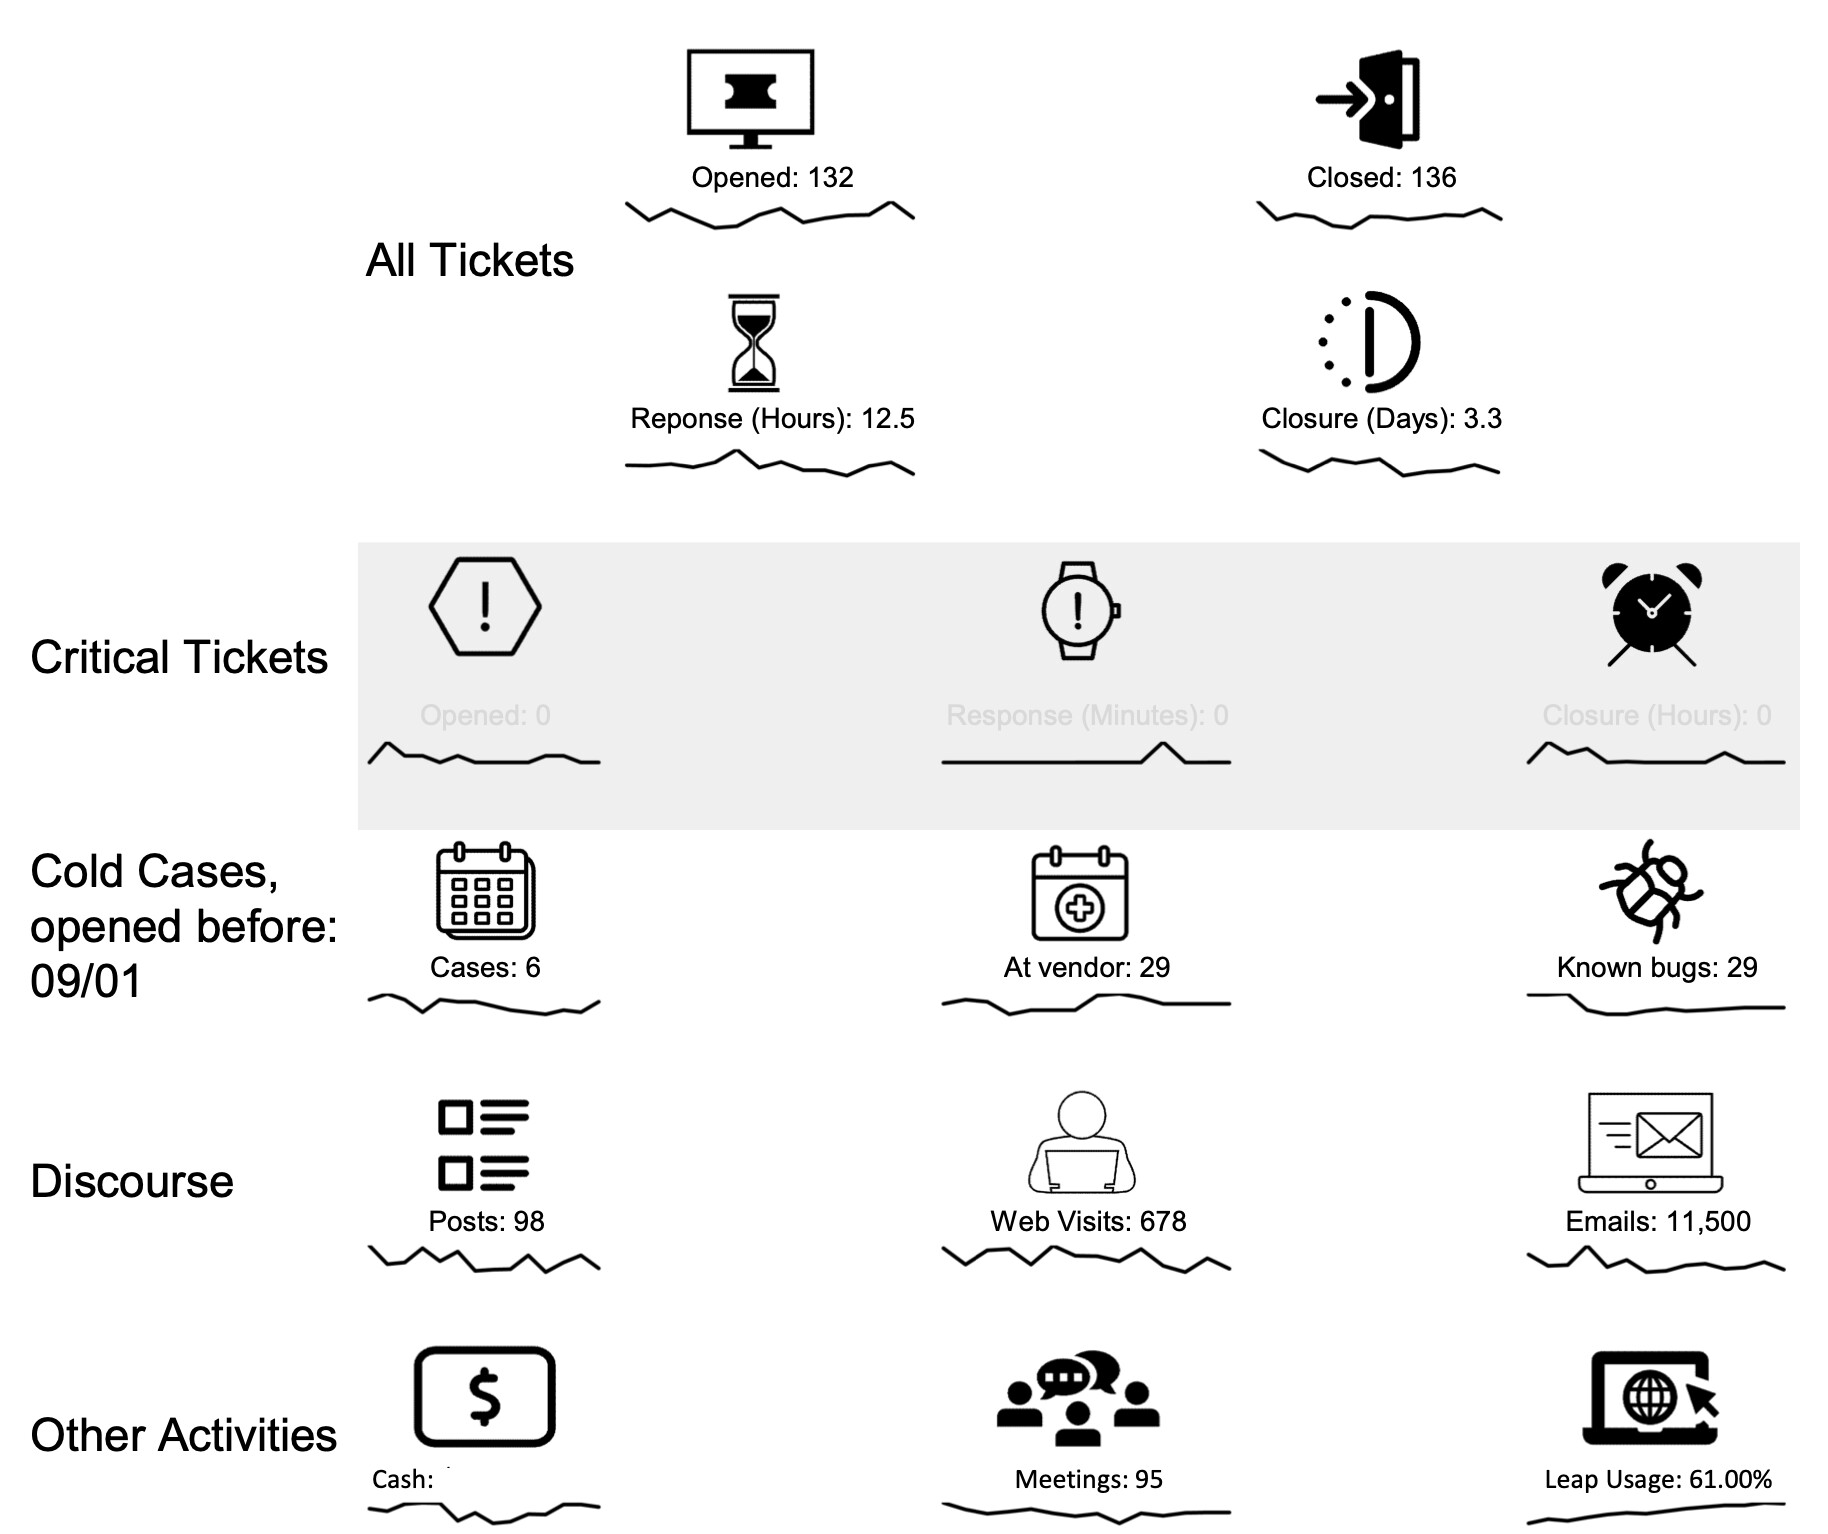
I’ll just add that since so much of our work at the consortia is service oriented, we also have a series of metrics that we report on around that information.
You can see a sample here, the sparklines showing a 13-month running view so if you want to spot anomalies or are looking for year-over-year seasonality comparisons you can look at the leftmost and rightmost points.
1 Like