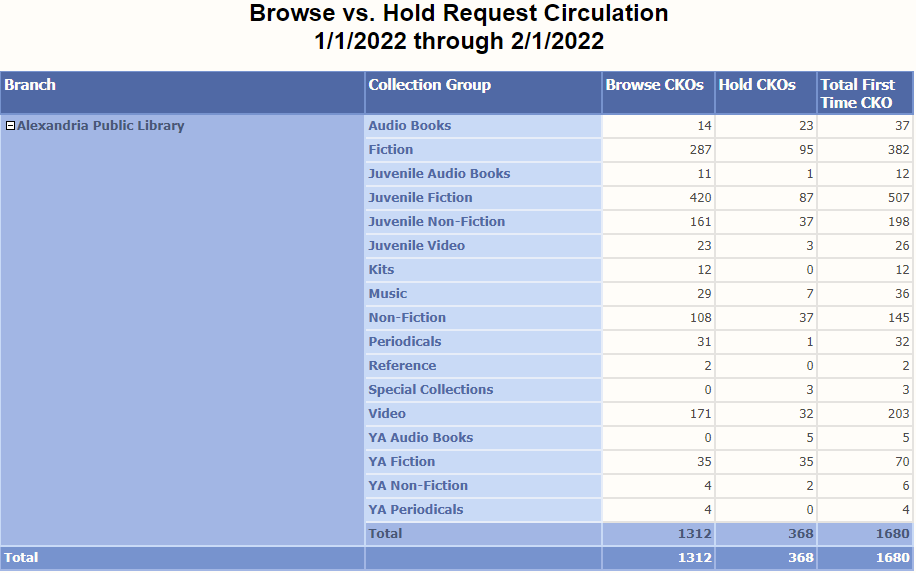
Displays the number of browse and hold first time checkouts for a specified library’s branches between two dates. Results can be grouped by either collection or material type using the Group By parameter dropdown.
@mfields Do you know if there is a similar report in Sierra? I have used filled holds and checkouts (initial cko) over the same time range and roughly compute the percentage of checkouts that were the result of a filled hold. Using WMR. I am not entirely sure of my method. Thanks for any insight!
Not natively in Sierra. We’ve been using a script/sql query to pull daily snapshots of those transaction counts (doing the same sort of math with them it sounds like you are) to feed into a dashboard. If you have Decision Center the transaction type trend report will give you monthly totals you can use going back 3 years, you just can’t break it out more specifically very easily there.